#
Readme Files
Readme files give additional information to projects and to topics. Readmes can either be edited directly in the GCMB UI (only project-level Readmes supported) or via a linked GitHub repository (both project-level and topic-level Readmes supported).
In Readme files, Markdown syntax can be used.
#
Using GitHub
The README.md for the project on gcmb.io must be placed in the gcmb folder of the GitHub project.
Topic README.md files must be placed in a folder relative to the gcmb folder. If you want to add
a README.md to the topic temperature, it must be placed in gcmb/temperature/README.md.
#
Components
In addition to regular Markdown, special tags can be used in GCMB Readme files to display live data.
#
Values
<Value topic="myorg/myproject/sometopic" />
#
SVGs
Define an SVG like this. Make it accessible via HTTP. If you are using GitHub for your Readmes, place it alongside the README.md of the project or topic.
A minimal SVG looks like this. Usually, you would use an SVG editor like Inkscape to create the file.
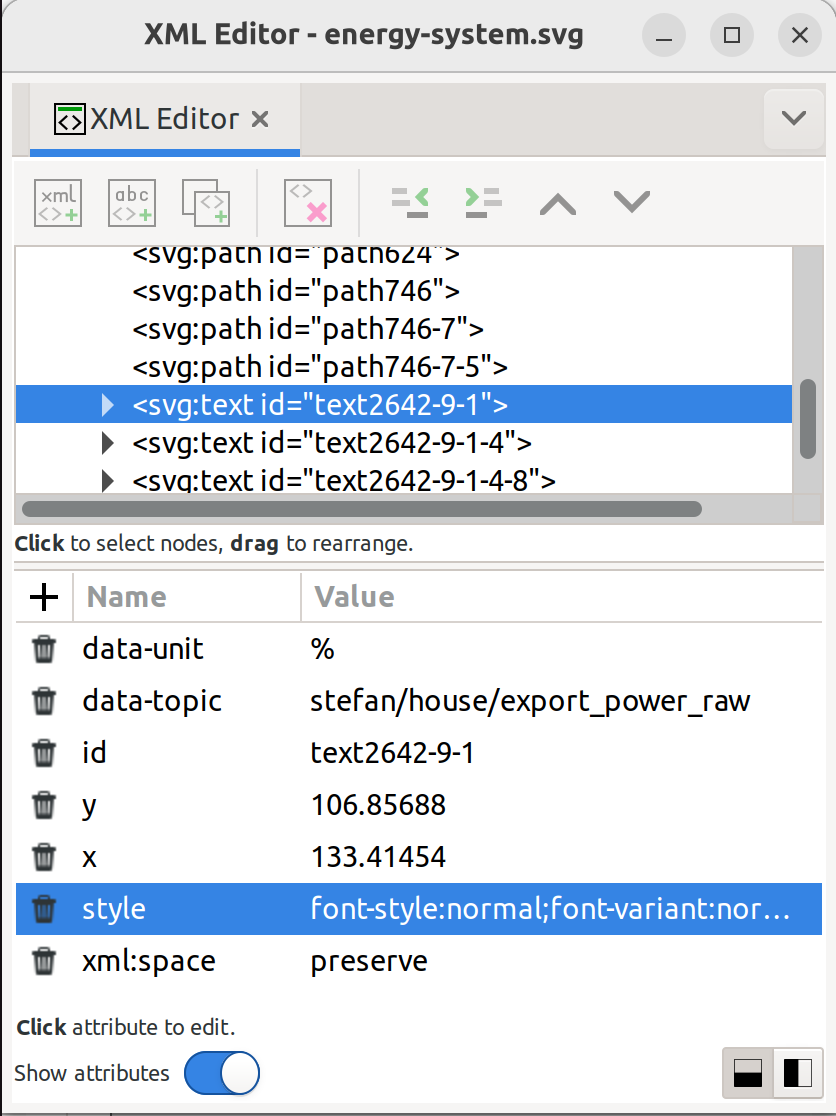
Note the data-topic attributes on the text elements. This is where the data will be injected.
<svg width="200" height="100" xmlns="http://www.w3.org/2000/svg">
  <text x="10" y="20" font-family="Arial" font-size="16" fill="black" data-topic="myorg/myproject/sometopic">
    Placeholder
  </text>

  <text x="10" y="50" font-family="Arial" font-size="16" fill="blue" data-topic="myorg/myproject/someothertopic">
    Placeholder
  </text>
</svg>
You can also add the data-unit attribute. The value of this attribute will get appended to all values.
Here is an example:
<svg width="200" height="100" xmlns="http://www.w3.org/2000/svg">
  <text x="10" y="20" font-family="Arial" font-size="16" fill="black" data-topic="myorg/myproject/power" data-unit="W">
    Placeholder
  </text>
#
Adding attributes in Inkscape
If you are using Inkscape, you can add attributes in the following manner. Select the text element. Open the XML editor:
![]()
Then add the data-* attributes:
#
Pie Charts
<PieChart>
  <Slice topic="myorg/myproject/sometopic" label="Some Topic" />
  <Slice topic="myorg/myproject/someothertopic" label="Some Other Topic" />
</PieChart>
#
Gauges
<Gauge topic="myorg/myproject/sometopic" minValue="0" maxValue="100" />